The worst roads in America (2024)
See where taking the road less traveled could cost you

The U.S. has the largest network of roads in the world, and heading out on the open highway is practically an American pastime. But from pitted roads to dangerous drivers, not all states make racking up the miles easy on you or your vehicle.
Using data from the U.S. Federal Highway Administration, we analyzed which states have the worst (and best) roads based on both safety and road quality. We also surveyed residents throughout the nation to read the signs on which states are making the grade and where you’re in for a rough ride.
Key insights
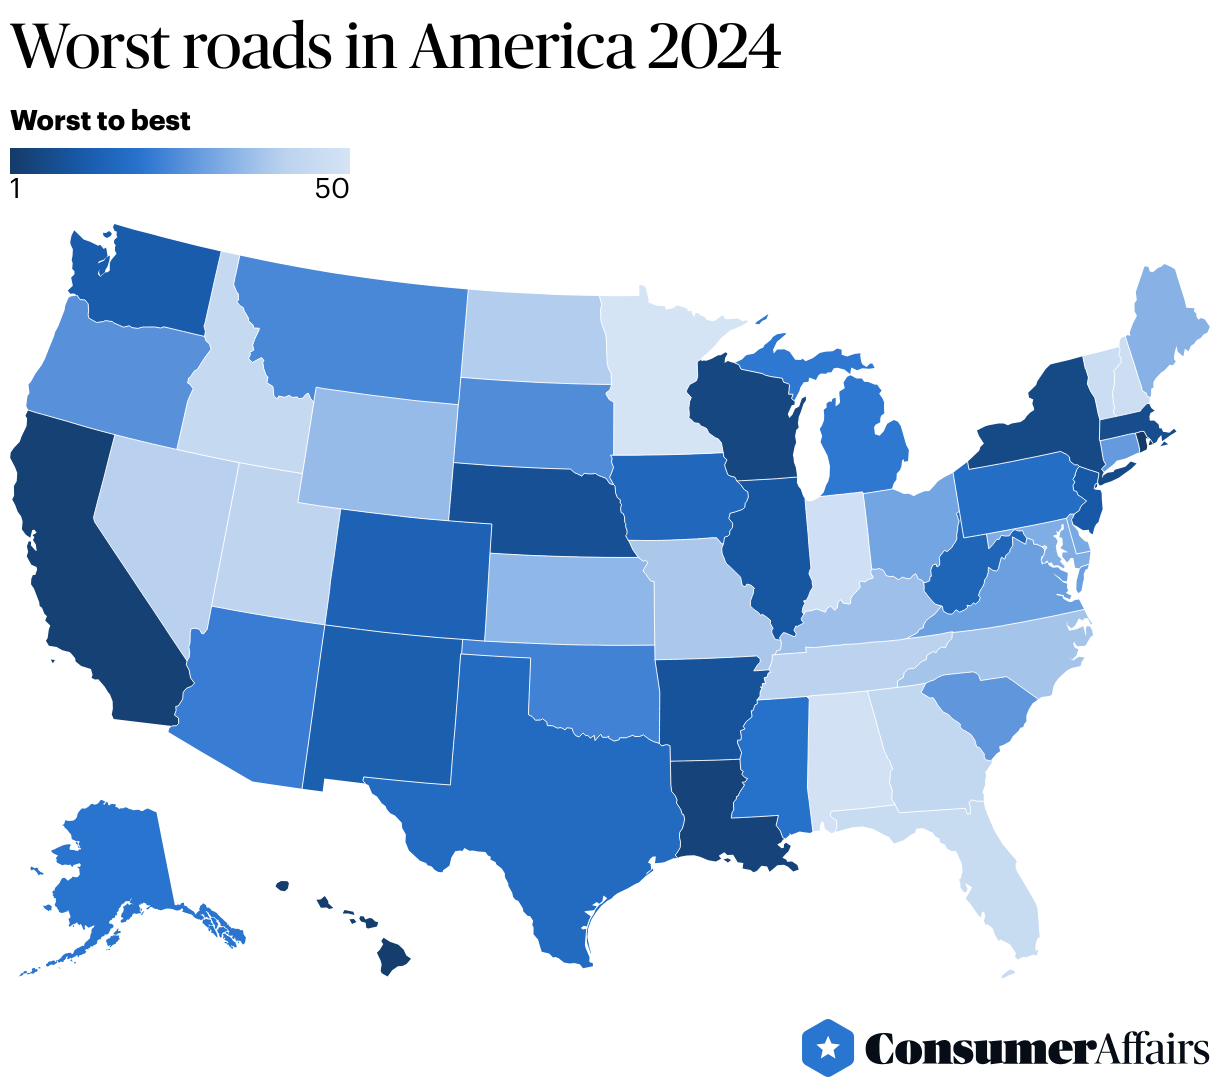
- Rhode Island has the worst roads, followed by Hawaii and California.
- Minnesota has the best roads, followed by Alabama and Indiana.
- A majority of states that ranked as having the worst roads are in coastal regions.
- Overall, respondents gave their roads an average score of 7 out of 10.
Methodology: Our formula for determining the worst and best roads in America uses weighted averages of scores based on the most recent available data from the U.S. Department of Transportation on fatalities, miles traveled, road roughness and spending on road improvements. Each state’s residents were also surveyed about the quality of roads on a scale of 1 to 10, with 1 being “terrible” and 10 being “excellent.” Ratings and comments from the survey were used anecdotally and not included in the ranking. Read our full methodology below.
Which states have the worst roads?
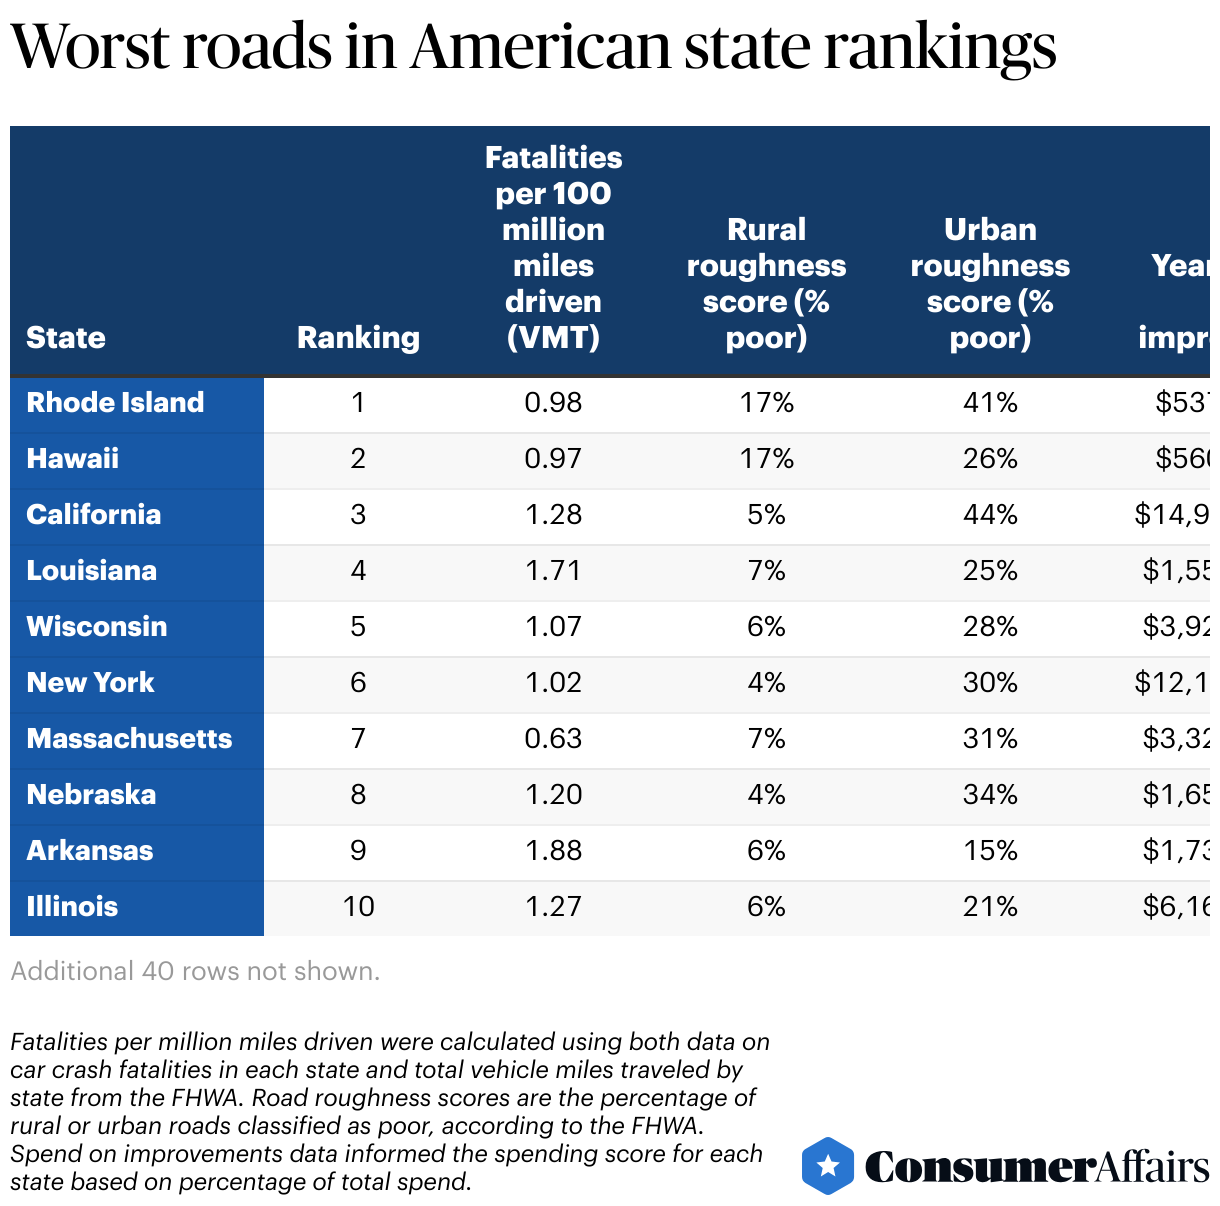
We ranked states with the worst roads based on road quality and traffic data as well as highway maintenance and safety budgets. Looking for your state? Scroll down to check out the complete list below.
1. Rhode Island
The only thing smaller than Rhode Island might be its budget for road expenditures, which is the smallest in the country. To be fair, those dollars have to stretch to cover a little more than 6,000 miles of public roads in the tiny Ocean State, the second fewest in the country.
Most Rhode Islanders live within 30 minutes of the coastline, so it’s probably not a coincidence that many of the urban roads they travel (41%) are in poor condition, according to the Federal Highway Administration. The United States Environmental Protection Agency (EPA) says both sea rise and increasing adverse weather events are major factors in road safety and quality.
Like most drivers in our survey, Rhode Island residents cited potholes as an outsize problem on their local roads. “Potholes, constant construction, high insurance rates for vehicles due to awful roads,” complained one respondent.
Given Rhode Island’s rocky reputation, a resident in the survey expressed frustration at ongoing road construction in the state. “They build a new road, and six months later they tear it up again,” the person said.
- Fatalities per 100 million miles driven: 0.976
- Percentage of rural roads rated poor: 17%
- Percentage of urban roads rated poor: 41%
- Yearly road improvement spend: $537.729 million
2. Hawaii
In the Aloha State, you can say hello to some rough roads courtesy of this island nation’s vast miles of coastline and a clash of other factors, including frequent rockslides, flash floods, wear and tear from livestock usage and the 9 million visitors who travel to Hawaii every year.
The wear and tear of all that tourism is showing on Hawaiian roads, with 26% of urban roads rated poor and 17% of rural roads similarly failing to make the grade. Despite deteriorating or distressed roads, Hawaii’s road budget for improvements is the second smallest in the country, and the state has the third-smallest budget for road expenditures.
Hawaiian residents in our survey said the lack of funding still shows despite the islands having fewer miles of rural roads than anywhere in America. Roads are described by drivers as riddled with “lots of potholes and either lack of capability to repair or shortcuts taken to avoid” the holes.
- Fatalities per 100 million miles driven: 0.968
- Percentage of rural roads rated poor: 17%
- Percentage of urban roads rated poor: 26%
- Yearly road improvement spend: $560.239 million
3. California
Despite an enormous yearly disbursement for highways that tops $21 billion, the Golden State manages to keep just a little more than half their urban roads in acceptable condition. However, this is an outsized job since, in addition to 840 miles of coastline, California boasts more miles of urban roads than any other state and has the second-highest mileage of rural roads in the country.
Data from the National Highway Administration shows California’s roads are the most traveled in the U.S., so it makes sense that the state also has the second-highest number of motor vehicle-related fatalities in the country.
Because the state embraces a wide variety of climates, from foggy San Francisco to balmy San Diego, California residential opinions in our road quality survey also varied widely.
“There are streets and roads that need to be repaved due to potholes, uneven pavement or weather damage,” one San Francisco resident complained.
Not all Californians feel the same, though. One respondent from Los Angeles said, “I feel like our roads are in great shape.”
- Fatalities per 100 million miles driven: 1.28
- Percentage of rural roads rated poor: 5%
- Percentage of urban roads rated poor: 44%
- Yearly road improvement spend: $14.981 billion
4. Louisiana
While nearly a quarter of the Bayou State’s urban roads are rated in poor condition, that’s not the only factor that earns Louisiana its reputation for some of the worst roads in America. Louisiana also has the fifth-highest rate of motor vehicle fatalities per mile driven in the country.
This may explain why Louisiana holds the dubious honor of the second most expensive car insurance in the country. The average annual policy premium costs $2,546 in Louisiana, about $864, or 51%, more than the national average.
So, what do Louisiana drivers have to say about the state of the roads in our survey? Most of our survey respondents cite a bumpy experience, and complaints about vehicle damage are common. “I sometimes wonder where my tax money goes! I've had two front end alignments within two years because of the roads,” one respondent said.
“Our state is not known for maintaining infrastructure,” another said.
- Fatalities per 100 million miles driven: 1.71
- Percentage of rural roads rated poor: 7%
- Percentage of urban roads rated poor: 25%
- Yearly road improvement spend: $1.552 billion
5. Wisconsin
According to some Wisconsin residents in our survey, the Badger State should be badgered into taking better care of the roads. “Many of the roads around the state are in very poor condition,” one survey respondent said.
Urban residents cite widespread potholes, but a rural county respondent said the state’s severe weather also plays a role. “We have winters with lots of snow, salt trucks [and] freezing weather, and it’s not good for the roads,” they said.
The data we dug into certainly supports that forecast: 28% of Wisconsin’s urban roads rated poor for road roughness. Rural roads fared a bit better, with only about 6% rated as poor throughout the state.
Transportation funding has long been a thorn in the side of Wisconsin residents as many local municipalities say they don’t have the budgets to maintain, let alone improve, the roads. State officials are also debating using toll roads to earn the revenue needed to update the state’s highway system.
- Fatalities per 100 million miles driven: 1.07
- Percentage of rural roads rated poor: 6%
- Percentage of urban roads rated poor: 28%
- Yearly road improvement spend: $3.926 billion
7. Massachusetts
A state with a reputation for high taxes probably has pretty great infrastructure, right? In the case of Massachusetts, not so much. Even when the Commonwealth State spends its wealth on roadways, it still sports about 31% of its urban roads in poor condition.
While Massachusetts' rocky, exposed coastline (mostly in the form of Cape Cod’s older bridges and roadways) certainly complicates things, the state also falls into the bottom ten in spending per mile — so there’s plenty of room for improvement.
What do Massachusetts locals have to say about their state’s infrastructure spending? Most in our survey describe the roads as adequate, but a few seem skeptical. “A lot of the roads are drivable, but many of them have potholes, cracks… the joke is all the tax money that isn't spent on fixing them,” one resident said
- Fatalities per 100 million miles driven: 0.63
- Percentage of rural roads rated poor: 7%
- Percentage of urban roads rated poor: 31%
- Yearly road improvement spend: $3.330 billion
6. New York
The Big Apple brings it home with the largest infrastructure budget in the country, ringing in at just over $24 billion annually. Shockingly, only about half of that money, or a little over $12 billion, is spent on road improvements.
While this could explain New York’s outsized percentage of urban roads rated in poor condition (30%), keep in mind the budget also has to stretch to cover the fourth-largest total miles of urban roadways in the country.
As you might expect, New Yorkers in our survey had pretty different opinions of road quality depending on where they lived. NYC residents cited dangerous traffic as a concern, while rural residents tended to rate the roads as “pretty good.” The one thing they could agree on? Potholes.
“There are so many potholes,” said one respondent. “I have even had a tire blow due to hitting a pothole. There are holes that just keep getting patched then turn into holes again.”
- Fatalities per 100 million miles driven: 1.02
- Percentage of rural roads rated poor: 4%
- Percentage of urban roads rated poor: 30%
- Yearly road improvement spend: $12.178 billion
8. Nebraska
If we’re handing out accolades for most improved states, Nebraska should step up and claim the award. “Some roads are filled with potholes, but the state has fixed a lot of them, so most are in a decent condition," said one of our survey respondents.
Another Nebraskan clarified that “there has been a lot of work done in the last five years, and they (the roads) are great compared to surrounding states.” Much of this is due to the $2.2 billion in federal funds from the Infrastructure Investment and Jobs Act that’s being used to improve the quality and safety of Nebraska's roadways.
Data from the Federal Highway Administration supports the praise from locals. The state has an improved spending score and relatively low percentages of rural roads rated poor for roughness — no small feat for a state with plenty of farmland and more than 3,000 miles of rural roads.
- Fatalities per 100 million miles: 1.2
- Percentage of rural roads rated poor: 4%
- Percentage of urban roads rated poor: 34%
- Yearly road improvement spend: $1.654 billion
9. Arkansas
Although a relatively low percentage of Arkansas roads are considered rough, the Natural State makes our list of states with the worst roads in America for one specific reason: the country’s third-highest rate of fatalities per mile driven.
TRIP, a national transportation research nonprofit group, indicates that traffic fatalities rose 27% in Arkansas between 2019 and 2022. While the rise initially puzzled experts, it’s been attributed to an increase in risky driving behaviors across the country.
Like most drivers in our survey, Arkansas residents were chiefly concerned with potholes that damage cars and road debris that punctures tires.
“Extremely slow construction,” one respondent said. “When construction is done, they leave rough bumps and ridges that are very jarring to drive over. Lots of potholes and debris in the roads and interstate.”
- Fatalities per 100 million miles driven: 1.88
- Percentage of rural roads rated poor: 6%
- Percentage of urban roads rated poor: 15%
- Yearly road improvement spend: $1.733 billion
10. Illinois
Despite a fairly robust yearly highway disbursement just shy of $9 billion dollars, Illinois is straddling the line with mediocre roads. About 20% of urban roads are considered in poor condition for road roughness.
The Illinois residents surveyed said “most of the roads are acceptable,” but that opinion varied depending on where they live. Chicago locals were likely to rate the roads as “poor” due to constant potholes, while rural residents seemed happy with the state’s road conditions.
“Illinois is known for having a pretty excellent highway system, and the snow removal is very diligent when the winter comes,” said one resident.
Illinois recently undertook an ambitious project to upgrade one of the most deteriorated highways in the state, I-255, and earned major kudos from the Department of Transportation for completing an extensive construction project to update the road in just nine months.
- Fatalities per 100 million miles driven: 1.26
- Percentage of rural roads rated poor: 6%
- Percentage of urban roads rated poor: 20%
- Yearly road improvement spend: $6.166 billion
States with the best roads
Spanning the country from the wintry north all the way to the sunny south, residents and data from government sources signal these U.S. states do more to ensure smooth streets and safe roadways.
1. Minnesota
The North Star State beckons with some of the smoothest, safest roads in the country — an especially admirable achievement since Minnesota’s cold temperatures, significant snowfall and proximity to the Great Lakes create a hazardous set of conditions that can be tough on roads and drivers.
With the second-lowest rate of fatalities per mile driven and the third-largest span of rural roads in the country, Minnesota puts its modest budget to good use. And the state multitasks in the country and the city, earning some of the lowest roughness percentages for both urban and rural roads in the United States.
What do Minnesotans have to say about their roads? Some residents in our survey simply described the roads as “good” or “pretty good,” but others went the extra mile in their praise. “My state roads are always taken care of. There are no potholes, the lanes are nice and wide, and the white/yellow lines are always up to date.”
- Fatalities per 100 million miles driven: 0.76
- Percentage of rural roads rated poor: 3%
- Percentage of urban roads rated poor: 5%
- Yearly road improvement spend: $4.284 billion
2. Alabama
Road roughness indexes indicate only about 1% of Alabama’s more than 2,500 miles of rural roads are in poor condition.
Alabama residents in our survey confirmed some of the roads were “newly updated,” although urban residents were much more likely to complain about potholes on Birmingham streets. One driver summed up the state of Alabama’s roadways succinctly as “pretty decent, and things get fixed quickly when necessary.”
Alabama’s roads have been given a much-needed facelift in recent years thanks to the Rebuild Alabama Act, a grant program established in 2019 to fund local projects. The state announced the third and final round of funding in 2023, providing $2.25 million to local municipalities for road and bridge improvements.
- Fatalities per 100 million miles driven: 1.38
- Percentage of rural roads rated poor: 1%
- Percentage of urban roads rated poor: 5%
- Yearly road improvement spend: $2.112 billion
3. Indiana
Indiana apparently takes its state motto of “The Crossroads of America” seriously. The Hoosier State’s location at the intersection of several cross-country interstates means it sees quite a bit of traffic, but the state manages to keep a relatively low rate of fatalities per mile driven.
The roughness index on Indiana’s rural roads is also enviable, with 2% or less categorized as in poor condition. This attention to upkeep shows in Indiana’s road expenditures, with a great portion of the budget allotted to road maintenance and improvement projects.
Indiana residents in our survey agreed their roads were “pretty decent” and “easy to drive on.” Even those who hailed from Indianapolis didn’t feel they could complain too much. “The road in my area is pretty good, as a matter of fact,” one survey respondent told us. “It has just a few potholes, which the authorities are coming to fix in a day or two.”
- Fatalities per 100 million miles driven: 1.17
- Percentage of rural roads rated poor: 2%
- Percentage of urban roads rated poor: 6%
- Yearly road improvement spend: $3.722 billion
4. New Hampshire
New Englanders are notorious for frugality, so it might not be a shock to see New Hampshire land on a list of best roads despite their meager road improvement budget. Rural roads in New Hampshire receive top marks, with only 3% in poor condition.
Urban roads in the Granite State are another matter, however. Residents who responded to our survey described their state roads as “old and outdated” or flat-out “horrible.” This aligns with government data indicating nine percent of New Hampshire’s more than 400 miles of urban roads are ranked in poor condition for road roughness.
At the heart of this problem is the complexity of how New Hampshire funds state-controlled roads. Transportation infrastructure is paid for either from federal dollars distributed through grant programs or through the state highway fund, whose revenues come from fuel taxes.
- Fatalities per 100 million miles driven: 0.869
- Percentage of rural roads rated poor: 3%
- Percentage of urban roads rated poor: 9%
- Yearly road improvement spend: $628.307 million
5. Vermont
New Hampshire’s neighbor, Vermont, is well-known for its scenic byways that see tons of traffic and tourists during leaf-peeping season. And while their road improvements budget is the smallest in the nation, the state seems to find ways to stretch those dollars.
While Vermont’s fatalities per mile driven isn’t the lowest in the country, the state does have the lowest total fatalities in the United States. The state attributes this achievement in part to the Vermont Strategic Highway Safety Plan (SHSP), which provides a framework for reducing fatalities and injuries on Vermont’s roadways.
Vermont residents we surveyed seemed to agree their roads were “OK, not perfect” but said they could be better. As one driver from Windsor specified, “They seem OK to me, but there's always room for improvement.”
- Fatalities per 100 million miles driven: 1.03
- Percentage of rural roads rated poor: 3%
- Percentage of urban roads rated poor: 9%
- Yearly road improvement spend: $579.794 million
6. Florida
Welcome to the Sunshine State, where a roadway improvements budget that tops $10 billion keeps most of the state’s rural and urban roads in great condition. Just 1% of Florida’s rural roads are rated “poor,” and only 5% of urban roads earned the same rating for road roughness.
Asking Florida residents what they think of their roads gave us answers that spanned from “great” to “OK,” with plenty of room for improvement. While most urban Floridians complained about potholes, others were concerned about road safety: “People drive erratic here and very dangerous,” one respondent said.
While Florida lands in the top 10 for fatality rate per mile driven, the state also sees an extraordinary amount of tourism, with an estimated 135 million visitors in 2023. These tourists and residents put a lot of stress on Florida’s roads and rack up 208,705 vehicle miles traveled, the country’s third-highest tally of miles annually.
- Fatalities per 100 million miles driven: 1.6
- Percentage of rural roads rated poor: 1%
- Percentage of urban roads rated poor: 5%
- Yearly road improvement spend: $10.980 billion
7. Idaho
Idaho spends almost all of its road expenditures budget on improvements, which earns the Gem State a top score on our best roads list. The state’s rural roadways span more than 2,000 miles of rugged landscape and mountainous terrain, making it challenging to upkeep this broad swathe of the rural west.
Idaho residents we surveyed agreed that harsh winters and snow were to blame for many of the potholes but said the roads were generally “very smooth and excellent.” One resident complained about there always being “some kind of construction,” however.
That situation isn’t going to improve anytime soon since Idaho has ambitious plans to invest in its infrastructure. The state is proposing a Transportation Investment Program plan that would involve 1,000 projects over the next seven years at a cost of $4.85 billion.
- Fatalities per 100 million miles driven: 1.22
- Percentage of rural roads rated poor: 5%
- Percentage of urban roads rated poor: 11%
- Yearly road improvement spend: $1.196 billion
8. Georgia
The International Roughness Index says it’s smooth sailing in Georgia, where only 1% of rural roads and 5% of urban roads are categorized as in poor condition. Georgians we surveyed generally agree, describing their roads as “pretty good and a lot better than some other states I’ve been in” and “smooth driving.”
Just because Georgia’s roads are smooth doesn’t mean they’re also safe, though. Georgia has the fourth-highest rate of fatalities per mile driven in the country. Of particular concern are distracted or speeding drivers who, according to The Atlanta-Journal Constitution, were suspected of being responsible for 45% of crashes in 2022.
To combat this and other issues like traffic congestion, the Georgia Department of Transportation has launched the Major Mobility Investment Program. The program plans to complete 11 major projects by 2025 to widen interchanges and enhance safety for drivers in the Atlanta metro area.
- Fatalities per 100 million miles driven: 1.43
- Rural road, % rated poor: 1%
- Urban road, % rated poor: 5%
- Yearly road improvement spend: $3.281 billion
9. Utah
Frequently cited in the top 10 states with the most population growth, the Beehive State is currently living life in the fast line. Fortunately, the infrastructure is keeping pace with growth, with a remarkably small percentage of rural roads (2%) rated poor for roughness and the fifth-lowest fatality rate per mile driven.
It’s worth noting the state has earned accolades for having the best-maintained highway bridges in the country because of its focus on roadway improvements.
Complaints about constant construction are common among Utah drivers we surveyed, but they conceded that most of the roads were “maintained” or in “good shape.” One driver, when asked to comment on road conditions, quipped, “They seem to be redone every summer, so they should be good.”
- Fatalities per 100 million miles driven: 0.912
- Percentage of rural roads rated poor: 2%
- Percentage of urban roads rated poor: 7%
- Yearly road improvement spend: $1.679 billion
10. Tennessee
The Volunteer State doesn’t need much help maintaining its roadways. Just 2% of Tennessee’s rural roads are deemed in poor condition, and they earn top marks for spending on improvements.
However, our survey respondents made it clear that potholes in urban roads, particularly in Nashville, seem to need some attention.
“The city I'm in is famously known for having a lot of potholes,” one Nashville resident said. Other respondents were irritated by all the construction.
The local news channels in Nashville have tried to keep a sense of humor about the pothole problem, supplying coverage that describes Nashville’s streets as strewn with holes so big that maybe residents could “fill it with water and make it a swimming pool.”
- Fatalities per 100 million miles driven: 1.6
- Percentage of rural roads rated poor: 2%
- Percentage of urban roads rated poor: 9%
- Yearly road improvement spend: $2.134 billion
2024 worst (and best) roads in America
Our survey respondents rated their state’s roads a respectable 7 out of 10, which reflects our findings that the vast majority of the country has relatively safe roads that are in acceptable or fair condition. The infographic below shows interstate highways in each state. Their color represents the overall road conditions in that state.
Bottom line
Perhaps due to humidity and other climate-related challenges, a larger number of coastal regions are represented among America’s worst roads. However, a few Southern coastal states, such as Georgia and Florida, have escaped this trend, with sizable road budgets and relatively low percentages of rural and urban streets rated “poor.”
You’d assume freezing temperatures in the northern United States would adversely affect road quality. However, Minnesota, Vermont and New Hampshire, which hit bottom of the thermometer for some of the coldest average temperatures in the U.S., still came out on top with the best roads in America.
And, last but not least, while spending did seem to have some effect on road quality and safety, it wasn’t the final word. Some states that have the highest total roads spending per capita, like New York, Wisconsin and Nebraska, rank in the 10 worst, while Alabama, Indiana and Florida all have some of the best roads in the country while spending less per capita on roads than most states.
Methodology
To determine the worst roads in America, we considered the following three main factors indicative of road quality. Our methodology takes into account each of these factors, weighted to emphasize the percentage of roads identified in each state as being of “poor” quality.
- Car accident fatalities per million miles driven: The data on car accident fatalities by state was sourced from the National Highway Traffic Safety Administration's Fatality Analysis Reporting System, then combined with data from the Federal Highway Administration (FHWA) on the total vehicle miles traveled in each state. After calculating fatalities per 100 million miles traveled, states were scored based on their rates relative to the state with the highest rate.
- Road surface roughness percentage: The Federal Highway Administration (FHWA) measures road roughness using specialized equipment that records the amount of vertical movement over a road section on both urban and rural roads. We determined the percentage of the total roadways classified as “poor” or “acceptable” according to FHWA criteria.
- Percentage of spend per state on road improvements: Using FHWA data, we evaluated each state's investment in road improvements, calculated as a percentage of total roadway expenditures in each state. States with lower percentages of road enhancements were considered to have poorer road conditions.
Article sources
ConsumerAffairs writers primarily rely on government data, industry experts and original research from other reputable publications to inform their work. Specific sources for this article include:
- U.S. Federal Highway Administration, “Persons Fatally Injured In Motor Vehicle Crashes - 2020 (1) Federal - Aid Highways.” Accessed Feb. 19, 2024.
- U.S. Federal Highway Administration, “FUNCTIONAL SYSTEM TRAVEL - 2020 (1) ANNUAL VEHICLE - MILES.” Accessed Feb. 19, 2024.
- U.S. Federal Highway Administration, “NATIONAL HIGHWAY SYSTEM LENGTH - 2020 MILES BY MEASURED PAVEMENT ROUGHNESS - RURAL” Accessed Feb. 19, 2024.
- U.S. Federal Highway Administration, “TOTAL DISBURSEMENTS FOR HIGHWAYS, ALL UNITS OF GOVERNMENT - 2019” Accessed Feb. 19, 2024.
You’re signed up
We’ll start sending you the news you need delivered straight to you. We value your privacy. Unsubscribe easily.